PyScript PyScript is a framework that allows users to create rich Python applications in the browser using HTML’s interface. PyScript aims to give users a first-class programming language that has consistent styling rules, is more expressive, and is easier to learn. What is PyScript? Well, here are some of the core components: Python in the browser: Enable drop-in content, external file hosting (made possible by the Pyodide project , thank you!), and application hosting without the reliance on server-side configuration Python ecosystem: Run many popular packages of Python and the scientific stack (such as numpy, pandas, scikit-learn, and more) Python with JavaScript: Bi-directional communication between Python and Javascript objects and namespaces Environment management: Allow users to define what packages and files to include for the page code to run Visual application development: Use readily available curated UI components, such as buttons, contain...
DATA SCIENCE SCHOOL
Top Data Science Interview Questions And Answers
Data Science is among the leading and most popular technologies in the world today. Major organizations are hiring professionals in this field. With the high demand and low availability of these professionals, Data Scientists are among the highest-paid IT professionals. This Data Science Interview preparation blog includes the most frequently asked questions in Data Science job interviews. Here is a list of these popular Data Science interview questions:
Q1. What is Data Science?
Q2. Differentiate between Data Analytics and Data Science
Q3. What do you understand about linear regression?
Q4. What do you understand by logistic regression?
Q5. What is a confusion matrix?
Q6. What do you understand by true-positive rate and false-positive rate?
Q7. How is Data Science different from traditional application programming?
Q8. Explain the difference between Supervised and Unsupervised Learning.
Q9. What is the difference between the long format data and wide format data?
Q10. Mention some techniques used for sampling. What is the main advantage of sampling?
Q11. What is bias in Data Science?
Following are the three categories into which these Data Science interview questions are divided:
1. Basic Level
1. What is Data Science?
Data Science is a field of computer science that explicitly deals with turning data into information and extracting meaningful insights out of it. The reason why Data Science is so popular is that the kind of insights it allows us to draw from the available data has led to some major innovations in several products and companies. Using these insights, we are able to determine the taste of a particular customer, the likelihood of a product succeeding in a particular market, etc.
2. Differentiate between Data Analytics and Data Science
| Data Analytics | Data Science |
| Data Analytics is a subset of Data Science. | Data Science is a broad technology that includes various subsets such as Data Analytics, Data Mining, Data Visualization, etc. |
| The goal of data analytics is to illustrate the precise details of retrieved insights. | The goal of data science is to discover meaningful insights from massive datasets and derive the best possible solutions to resolve business issues. |
| Requires just basic programming languages. | Requires knowledge in advanced programming languages. |
| It focuses on just finding the solutions. | Data Science not only focuses on finding the solutions but also predicts the future with past patterns or insights. |
| A data analyst’s job is to analyse data in order to make decisions. | A data scientist’s job is to provide insightful data visualizations from raw data that are easily understandable. |
3. What do you understand about linear regression?
Linear regression helps in understanding the linear relationship between the dependent and the independent variables. Linear regression is a supervised learning algorithm, which helps in finding the linear relationship between two variables. One is the predictor or the independent variable and the other is the response or the dependent variable. In Linear Regression, we try to understand how the dependent variable changes w.r.t the independent variable. If there is only one independent variable, then it is called simple linear regression, and if there is more than one independent variable then it is known as multiple linear regression.
4. What do you understand by logistic regression?
Logistic regression is a classification algorithm that can be used when the dependent variable is binary. Let’s take an example. Here, we are trying to determine whether it will rain or not on the basis of temperature and humidity.
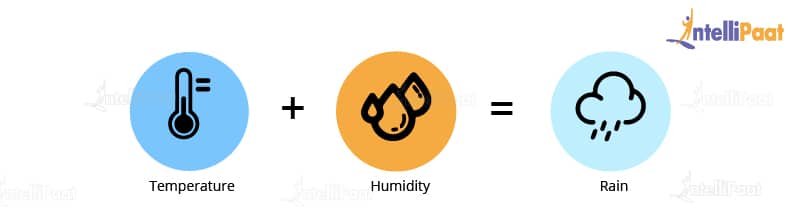
Temperature and humidity are the independent variables, and rain would be our dependent variable. So, the logistic regression algorithm actually produces an S shape curve.
Now, let us look at another scenario: Let’s suppose that x-axis represents the runs scored by Virat Kohli and the y-axis represents the probability of the team India winning the match. From this graph, we can say that if Virat Kohli scores more than 50 runs, then there is a greater probability for team India to win the match. Similarly, if he scores less than 50 runs then the probability of team India winning the match is less than 50 percent.
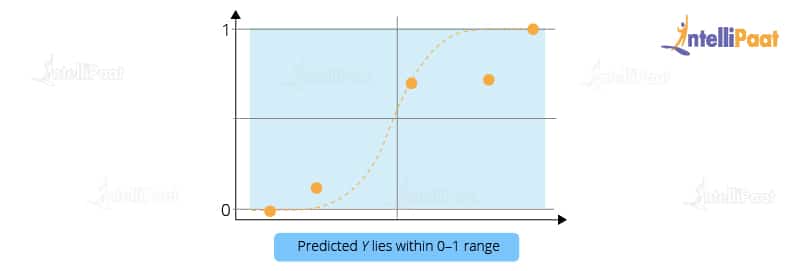
So, basically in logistic regression, the Y value lies within the range of 0 and 1. This is how logistic regression works.
5. What is a confusion matrix?
The confusion matrix is a table that is used to estimate the performance of a model. It tabulates the actual values and the predicted values in a 2×2 matrix.
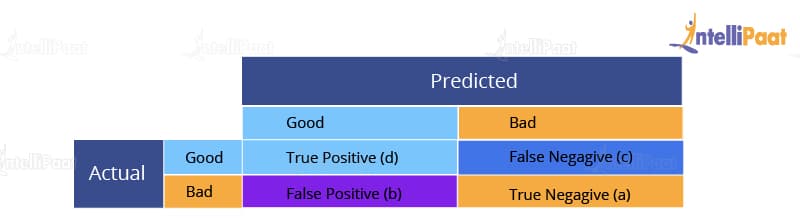
True Positive (d): This denotes all of those records where the actual values are true and the predicted values are also true. So, these denote all of the true positives. False Negative (c): This denotes all of those records where the actual values are true, but the predicted values are false. False Positive (b): In this, the actual values are false, but the predicted values are true. True Negative (a): Here, the actual values are false and the predicted values are also false. So, if you want to get the correct values, then correct values would basically represent all of the true positives and the true negatives. This is how the confusion matrix works.
6. What do you understand about the true-positive rate and false-positive rate?
True positive rate: In Machine Learning, true-positive rates, which are also referred to as sensitivity or recall, are used to measure the percentage of actual positives which are correctly identified. Formula: True Positive Rate = True Positives/Positives False positive rate: False positive rate is basically the probability of falsely rejecting the null hypothesis for a particular test. The false-positive rate is calculated as the ratio between the number of negative events wrongly categorized as positive (false positive) upon the total number of actual events. Formula: False-Positive Rate = False-Positives/Negatives.
7. How is Data Science different from traditional application programming?
Data Science takes a fundamentally different approach in building systems that provide value than traditional application development.
In traditional programming paradigms, we used to analyze the input, figure out the expected output, and write code, which contains rules and statements needed to transform the provided input into the expected output. As we can imagine, these rules were not easy to write, especially, for data that even computers had a hard time understanding, e.g., images, videos, etc.
Data Science shifts this process a little bit. In it, we need access to large volumes of data that contain the necessary inputs and their mappings to the expected outputs. Then, we use Data Science algorithms, which use mathematical analysis to generate rules to map the given inputs to outputs.
This process of rule generation is called training. After training, we use some data that was set aside before the training phase to test and check the system’s accuracy. The generated rules are a kind of a black box, and we cannot understand how the inputs are being transformed into outputs.
However, If the accuracy is good enough, then we can use the system (also called a model).
As described above, in traditional programming, we had to write the rules to map the input to the output, but in Data Science, the rules are automatically generated or learned from the given data. This helped solve some really difficult challenges that were being faced by several companies.
8. Explain the differences between supervised and unsupervised learning.
Supervised and unsupervised learning are two types of Machine Learning techniques. They both allow us to build models. However, they are used for solving different kinds of problems.
| Supervised Learning | Unsupervised Learning |
| Works on the data that contains both inputs and the expected output, i.e., the labeled data | Works on the data that contains no mappings from input to output, i.e., the unlabeled data |
| Used to create models that can be employed to predict or classify things | Used to extract meaningful information out of large volumes of data |
| Commonly used supervised learning algorithms: Linear regression, decision tree, etc. | Commonly used unsupervised learning algorithms: K-means clustering, Apriori algorithm, etc. |

9. What is the difference between the long format data and wide format data?
| Long Format Data | Wide Format Data |
| A long format data has a column for possible variable types and a column for the values of those variables. | Whereas, Wide data has a column for each variable. |
| Each row in the long format represents one time point per subject. As a result, each topic will contain many rows of data. | The repeated responses of a subject will be in a single row, with each response in its own column, in the wide format. |
| This data format is most typically used in R analysis and for writing to log files at the end of each experiment. | This data format is most widely used in data manipulations, stats programmes for repeated measures ANOVAs and is seldom used in R analysis. |
| A long format contains values that do repeat in the first column. | A wide format contains values that do not repeat in the first column. |
| Use df.melt() to convert wide form to long form | use df.pivot().reset_index() to convert long form into wide form |
10. Mention some techniques used for sampling. What is the main advantage of sampling?
Sampling is defined as the process of selecting a sample from a group of people or from any particular kind for research purposes. It is one of the most important factors which decides the accuracy of a research/survey result.
Mainly, there are two types of sampling techniques:
Probability sampling: It involves random selection which makes every element get a chance to be selected. Probability sampling has various subtypes in it, as mentioned below:
- Simple Random Sampling
- Stratified sampling
- Systematic sampling
- Cluster Sampling
- Multi-stage Sampling
- Non- Probability Sampling: Non-probability sampling follows non-random selection which means the selection is done based on your ease or any other required criteria. This helps to collect the data easily. The following are various types of sampling in it:
- Convenience Sampling
- Purposive Sampling
- Quota Sampling
- Referral /Snowball Sampling
11. What is bias in Data Science?
Bias is a type of error that occurs in a Data Science model because of using an algorithm that is not strong enough to capture the underlying patterns or trends that exist in the data. In other words, this error occurs when the data is too complicated for the algorithm to understand, so it ends up building a model that makes simple assumptions. This leads to lower accuracy because of underfitting. Algorithms that can lead to high bias are linear regression, logistic regression, etc.==
12. What is dimensionality reduction?
Dimensionality reduction is the process of converting a dataset with a high number of dimensions (fields) to a dataset with a lower number of dimensions. This is done by dropping some fields or columns from the dataset. However, this is not done haphazardly. In this process, the dimensions or fields are dropped only after making sure that the remaining information will still be enough to succinctly describe similar information.
13. Why is Python used for Data Cleaning in DS?
Data Scientists have to clean and transform the huge data sets in a form that they can work with. It is important to deal with the redundant data for better results by removing nonsensical outliers, malformed records, missing values, inconsistent formatting, etc.
Python libraries such as Matplotlib, Pandas, Numpy, Keras, and SciPy are extensively used for Data cleaning and analysis. These libraries are used to load and clean the data and do effective analysis. For example, a CSV file named “Student” has information about the students of an ins
titute like their names, standard, address, phone number, grades, marks, etc.
14. Why is R used in Data Visualization?
R provides the best ecosystem for data analysis and visualization with more than 12,000 packages in Open-source repositories. It has huge community support, which means you can easily find the solution to your problems on various platforms like StackOverflow.
It has better data management and supports distributed computing by splitting the operations between multiple tasks and nodes, which eventually decreases the complexity and execution time of large datasets.
15. What are the popular libraries used in Data Science?
Below are the popular libraries used for data extraction, cleaning, visualization, and deploying DS models:
- TensorFlow: Supports parallel computing with impeccable library management backed by Google.
- SciPy: Mainly used for solving differential equations, multidimensional programming, data manipulation, and visualization through graphs and charts.
- Pandas: Used to implement the ETL(Extracting, Transforming, and Loading the datasets) capabilities in business applications.
- Matplotlib: Being free and open-source, it can be used as a replacement for MATLAB, which results in better performance and low memory consumption.
- PyTorch: Best for projects which involve Machine Learning algorithms and Deep Neural Networks.
Interested to learn more about Data Science, check out our Data Science Course in New York!
16. What is variance in Data Science?
Variance is a type of error that occurs in a Data Science model when the model ends up being too complex and learns features from data, along with the noise that exists in it. This kind of error can occur if the algorithm used to train the model has high complexity, even though the data and the underlying patterns and trends are quite easy to discover. This makes the model a very sensitive one that performs well on the training dataset but poorly on the testing dataset, and on any kind of data that the model has not yet seen. Variance generally leads to poor accuracy in testing and results in overfitting.
17. What is pruning in a decision tree algorithm?
Pruning a decision tree is the process of removing the sections of the tree that are not necessary or are redundant. Pruning leads to a smaller decision tree, which performs better and gives higher accuracy and speed.
18. What is entropy in a decision tree algorithm?
In a decision tree algorithm, entropy is the measure of impurity or randomness. The entropy of a given dataset tells us how pure or impure the values of the dataset are. In simple terms, it tells us about the variance in the dataset.
For example, suppose we are given a box with 10 blue marbles. Then, the entropy of the box is 0 as it contains marbles of the same color, i.e., there is no impurity. If we need to draw a marble from the box, the probability of it being blue will be 1.0. However, if we replace 4 of the blue marbles with 4 red marbles in the box, then the entropy increases to 0.4 for drawing blue marbles.
19. What information is gained in a decision tree algorithm?
When building a decision tree, at each step, we have to create a node that decides which feature we should use to split data, i.e., which feature would best separate our data so that we can make predictions. This decision is made using information gain, which is a measure of how much entropy is reduced when a particular feature is used to split the data. The feature that gives the highest information gain is the one that is chosen to split the data.
#pandas
#numpy
#matplotlib
#jupyternotebook
#datascience
Comments
Post a Comment